


In my series about bioanalysis for the pharmacokineticist, I thought I would start with the bioanalysis methodology that was in use when I began my career in pharmaceutical development: HPLC/UV. The first part of this method (HPLC) is the separation technology. The second part (UV) is the detection technology. In the remainder of this post, I will describe each of these in some detail.
High Performance Liquid Chromatography (HPLC) is used to separate molecules using chromatographic techniques. Chromatography is the science of separating molecules by running a mobile phase through a stationary phase. The mobile phase contains the molecule of interest, which is dissolved in the solution. the stationary phase contains physical, chemical or other components that separate the molecule of interest from other molecules in the stationary phase. Why is it called “High Performance”? It used to be called “High Pressure,” but that was changed several years back. Standard chromatographic techniques were slow and relied on gravity to move the mobile phase. High Performance chromatographic techniques employed pressurizing the mobile phase to move it through the stationary phase more quickly. Eventually, the name was changed to High Performance to reflect the improved separating performance of this pressurized technique.
HPLC separates molecules using a variety of methods, but it isn’t necessary to understand the fundamental details of each method. Rather, a basic overview will provide enough information to allow the pharmacokineticist to appreciate the science. Imagine a bottle of 10,000 marbles, each with a different diameter, and we want to select marbles of a specific diameter. Since we don’t want to manually measure each marble, we can create a set of “filters”. The filters will have different size holes. The holes would range from just larger than the smallest diameter to much larger than the largest diameter. If we place these filters in series inside of a large tube, we would then pour the bottle of mixed marbles into one end of the tube and wait for the marbles to come out the other end of the tube. The smallest marbles will easily navigate the filters because they will fit through any of the holes. On the other hand, the largest marbles will take the longest because they will have to “search” for the holes that will accommodate their diameter. Thus, we would expect the marbles to come out of the tube starting with the smallest and ending with the largest. These filters have thus, separated the marbles based on size, hence the name “size-exclusion” chromatography.
Example of size exclusion chromatography.
.
Please note that in true size exclusion chromatography, the larger molecules exit first and the smaller molecules exit last based on the construction of the columns. Columns include large “beads” that have small pores in them. This results in small molecules having to travel through these pores in the beads while large molecules simply travel around the beads. Despite this difference from the example, the concept is the same. Other chromatographic methods include lipophilicity, charge, ligand affinity, and more. Essentially, HPLC is an attempt to separate molecules in the mobile phase based on some chemical, biological, or physical property.
The second part of the bioanalysis system is the detection technology. In this example, it is UltraViolet (UV) light. Almost all chemicals absorb UV light at specific wavelengths. Using Beer’s law (Beer-Lambert Law) we can relate the concentration of the chemical to the amount of UV absorption. Therefore, we can take some known concentrations of the molecule of interest (these are called standards) and run them through the UV detector and measure their response. Then the various responses can be plotted vs. the molecule concentration. Using Beer’s Law, the relationship between response and concentration can be defined (called a calibration curve). Now if we have a solution with an unknown amount of a molecule, we can measure the UV response and calculate the concentration using the calibration curve.
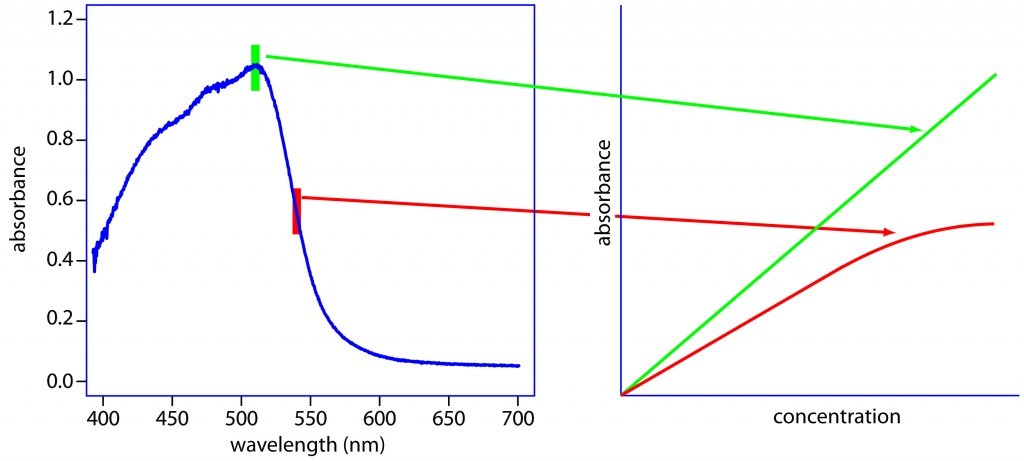
Example of UV absorption profile and relationship to concentration.
Now, putting these two things together, we use HPLC to separate the molecules in the mobile phase so that only one molecule at a time comes out of the separation “tube”. At the end of that tube, we shine a UV light on the solution and detect the response. That response can then be converted into a concentration using Beer’s Law and the calibration curve.
There are many more complexities and details, some of which we will discuss in later posts. But for now, the goal was to provide an overview of the basics of separation and detection using one of the most simple systems for bioanalysis. Our next posts will review additional separation methodologies and detection systems.
The use of modeling and simulation (M&S) in drug development has evolved from being a research nicety to a regulatory necessity. Today, modeling and simulation is leveraged to some extent, across most development programs to understand and optimize key decisions related to safety, efficacy, dosing, special populations, and others.
Read our white paper to learn about the many benefits of M&S across a drug development program.
